Peak sun hours: what the number actually means
Peak sun hours are not hours of daylight. What the figure measures, why Cyprus scores well on it, and how to get the number for your own address.
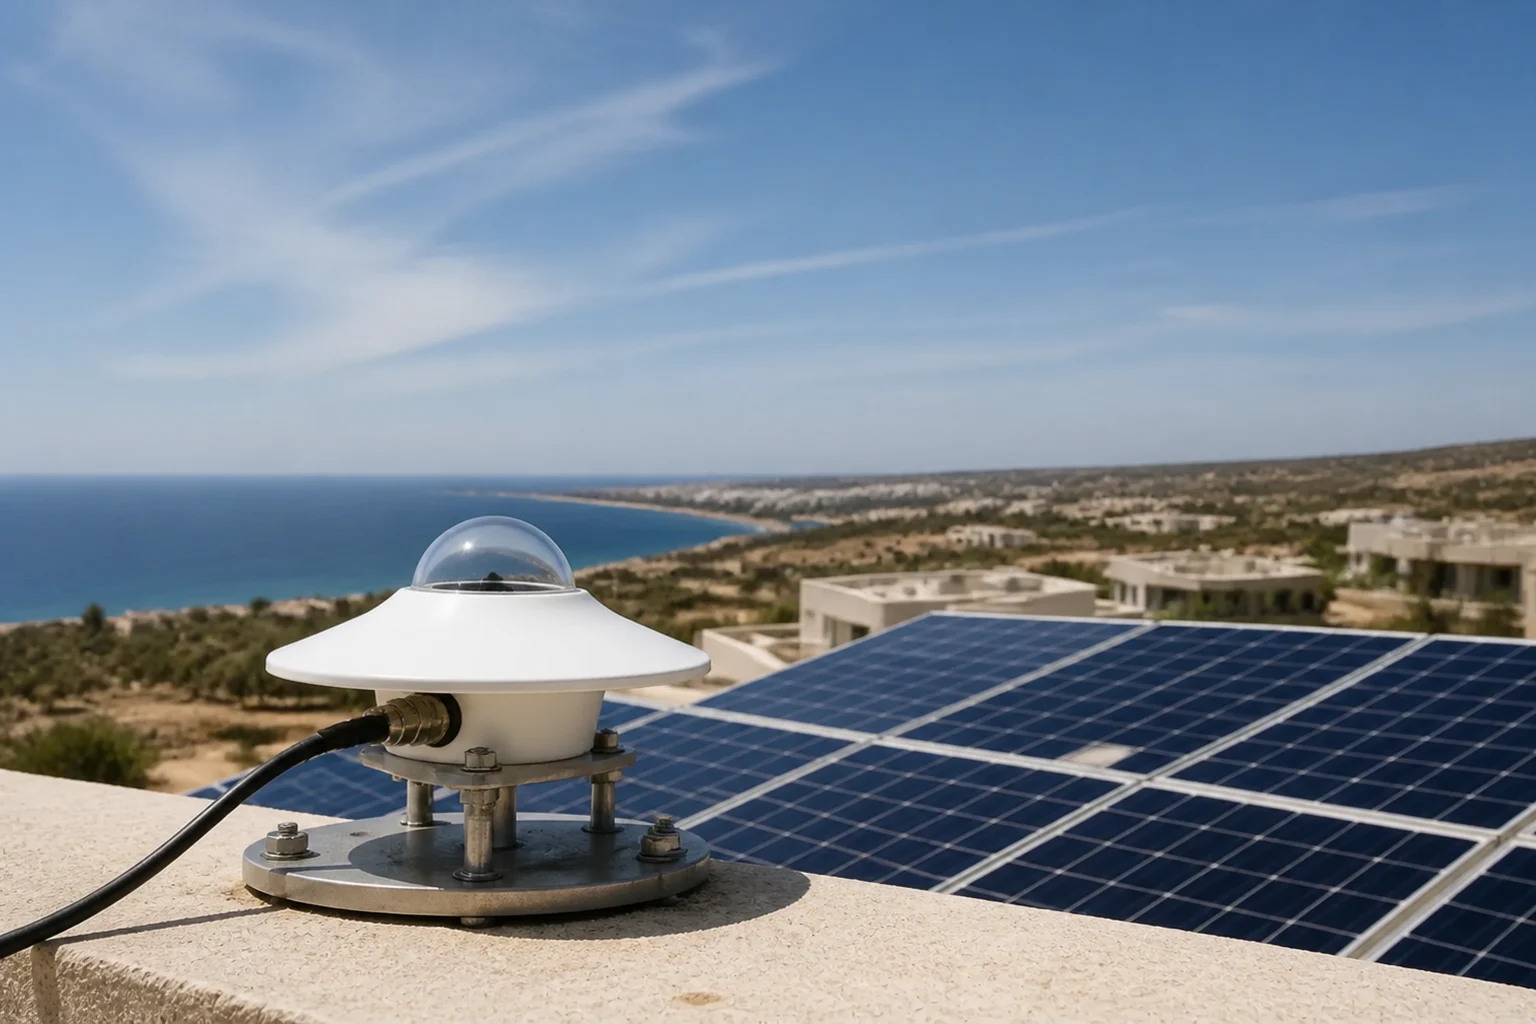
The article explains general patterns. Your roof, your equipment and your consumption differ, and the numbers for them come from a survey.
"Peak sun hours" is the figure every quote quietly depends on and almost no quote explains. It is worth ten minutes, because once you understand it you can check an installer's arithmetic yourself.
What the number measures
Solar equipment is rated under a reference condition: one kilowatt of light falling on each square metre. Real sunlight is rarely exactly that. It is weak at dawn, strong at noon, and cut by cloud in between.
Peak sun hours compress that whole uneven day into one number: how many hours of reference-strength sunlight would deliver the same total energy. A day that drips light from six in the morning to seven in the evening might amount to five or six peak sun hours.
So the figure is an energy total wearing the costume of a duration.
Why it is not "hours of daylight"
This is the mistake that inflates estimates. Cyprus has long days and a large number of clear ones, and it is tempting to multiply daylight hours by panel rating. That calculation overstates production by a wide margin, because most daylight hours are nowhere near reference strength.
Daylight length and peak sun hours move together, but they are not the same quantity, and only the second one predicts energy.
What it does and does not tell you about Cyprus
Cyprus sits well for this figure. It is far enough south, dry enough, and clear enough that its annual peak sun hours are among the higher values in Europe. That is the honest and useful version of "Cyprus has a lot of sun".
What the figure does not tell you is what your roof will produce. Between the sunlight arriving at your address and the kilowatt-hours reaching your meter sit several losses that have nothing to do with location: the angle of your roof, shading, cell temperature on hot days, inverter efficiency, cable losses and dust on the glass.
A national average is a starting point for a conversation, not an input to your own calculation.
How to get the figure for your own roof
The European Commission publishes PVGIS, a free tool that estimates production for a specific point on the map. It is the same underlying data set that serious installers use, and it is open to anyone.
Put in your address, set the tilt and the direction your roof faces, state the system size, and it returns monthly and annual production for that exact configuration. Two things make it worth doing yourself:
- you get a number for your roof rather than for the island
- you get a baseline to compare against the number in a quote
If a quote promises significantly more than PVGIS for the same size, angle and address, that difference is a question worth asking out loud. It is not automatically wrong — an installer may be modelling different equipment — but it should have an explanation.
Where the rest of the losses come from
Nothing in the chain is lossless. The panel is rated in laboratory conditions it will rarely meet. The inverter takes its own small cut. Cells lose efficiency as they heat, which in a Cyprus summer is a real and predictable effect rather than a footnote. Dust reduces what reaches the cells until it is washed off. Panels degrade slowly over their life.
These are all normal and all expected. What matters is that a production estimate has accounted for them somewhere, rather than presenting laboratory output as an annual forecast.