How much a solar system generates in Cyprus
The figures below are the annual output of one kilowatt of installed capacity, calculated by the Joint Research Centre of the European Commission for one point in each district.
Your own roof will give less. Shade from a parapet or a neighbouring building, dust between rains, a tilt set by the mounting rather than by the sun, the age of the equipment — each takes its share, and the spread between two roofs on the same street is wider than the spread between districts.
What this figure measures, explained in full
Reference conditions of the calculation
- Facing south
- Tilt set to the optimum for the point
- System losses 14%
- Crystalline silicon modules mounted on a building
- Radiation database PVGIS-SARAH3
- PVGIS version 5.3
Calculated by PVGIS, Joint Research Centre of the European Commission. We requested these figures on and store them as they arrived.Run the calculation for your own address
Annual output by district
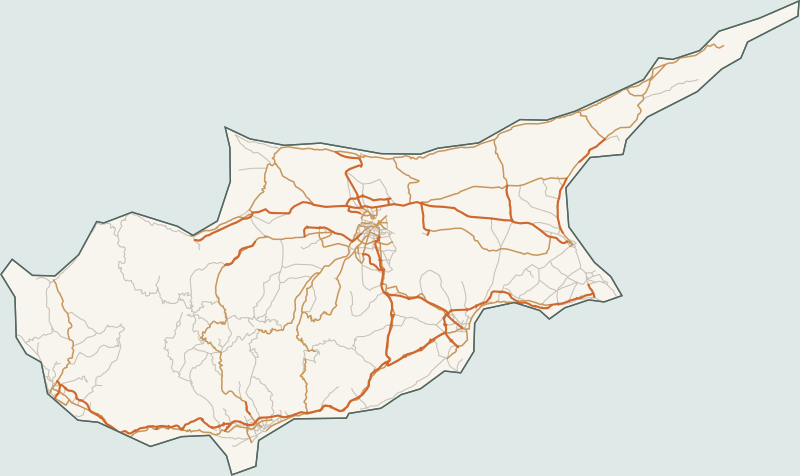
- Nicosia1,557 kWh
- Limassol1,640 kWh
- Larnaca1,595 kWh
- Paphos1,636 kWh
- Famagusta1,669 kWh
| District | Output per kilowatt installed |
|---|---|
| NicosiaCalculated for Nicosia, 35.165 / 33.36 | 1,557 kWh per year |
| LimassolCalculated for Limassol, 34.6841 / 33.0379 | 1,640 kWh per year |
| LarnacaCalculated for Larnaca, 34.9182 / 33.6201 | 1,595 kWh per year |
| PaphosCalculated for Paphos, 34.7754 / 32.4245 | 1,636 kWh per year |
| FamagustaCalculated for Paralimni, 35.0378 / 33.9822 | 1,669 kWh per year |
How tilt and orientation change the figure
Percentages are of the reference calculation for Nicosia: facing south at the optimum tilt of 32°.
| Tilt | South | East | West |
|---|---|---|---|
| 0° | 89% A horizontal plane has no orientation; on a flat roof the tilt comes from the mounting. | ||
| 15° | 97% | 87% | 86% |
| 30° | 100% | 84% | 82% |
Across the year
The summer maximum falls in the air-conditioning season: the electricity is generated in the hours it is used.
In winter the output drops but does not stop.
- January99 kWh
- February106 kWh
- March136 kWh
- April140 kWh
- May145 kWh
- June145 kWh
- July153 kWh
- August151 kWh
- September141 kWh
- October130 kWh
- November112 kWh
- December99 kWh