Heat and output: why the hottest hour is not the best
Panel ratings are measured at 25 °C. On a Cyprus roof in August the cells are nowhere near it, and the loss is predictable rather than mysterious.
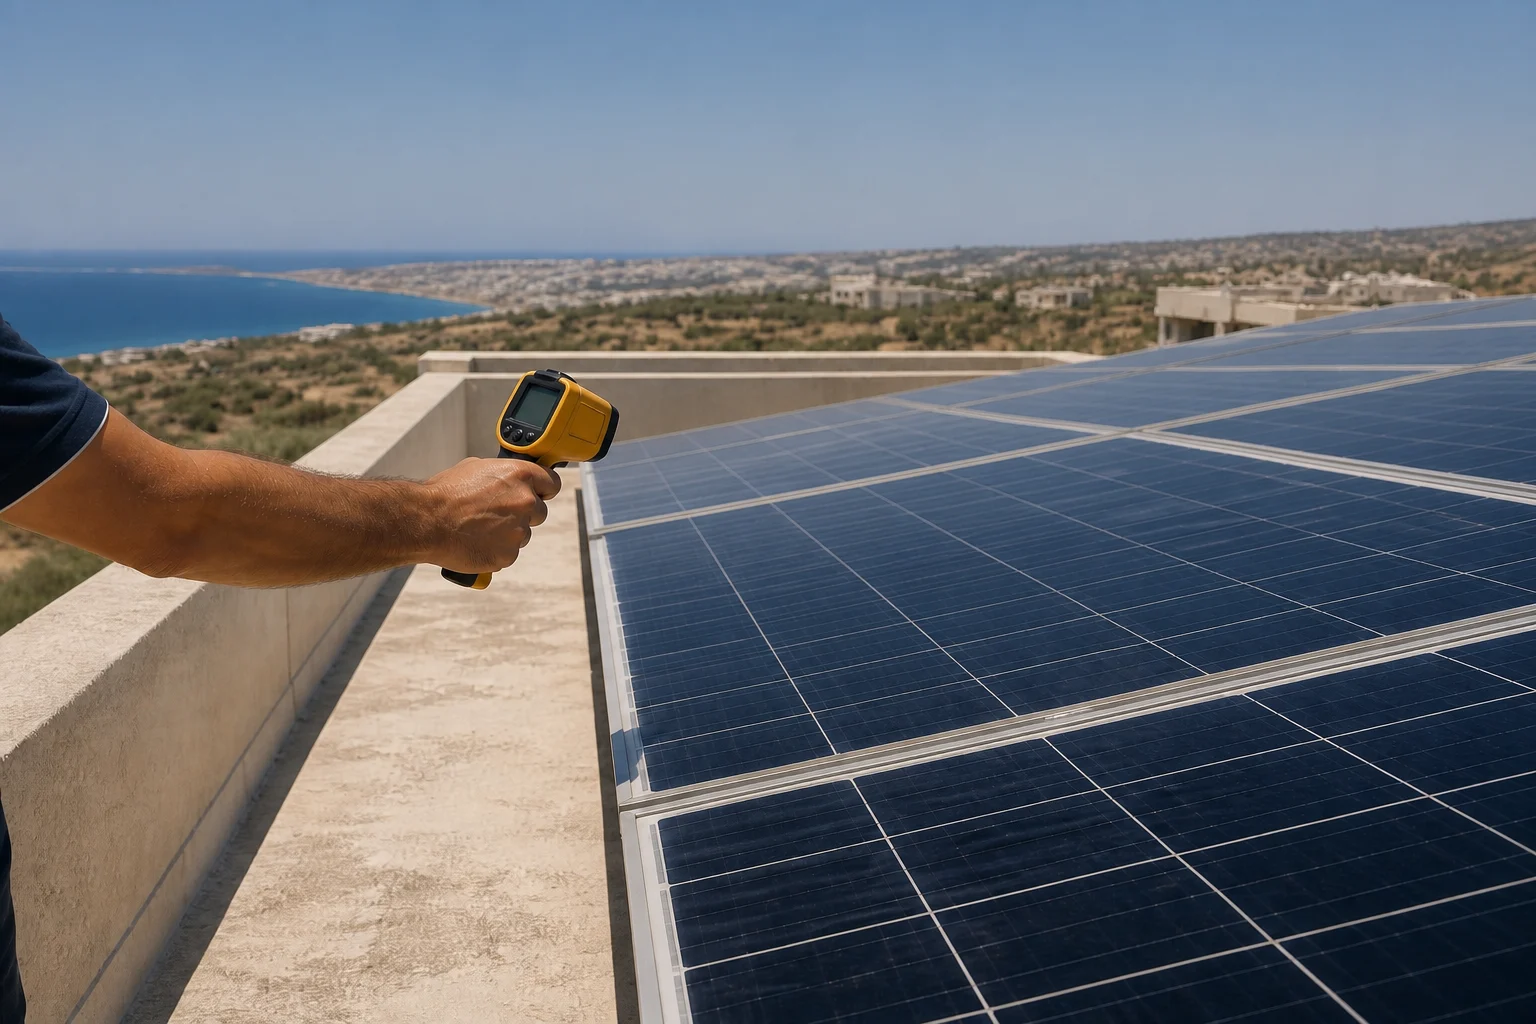
The article explains general patterns. Your roof, your equipment and your consumption differ, and the numbers for them come from a survey.
People expect the year's best production day to be the one that feels hottest. It is not, and the reason is written into the number on the datasheet.
The article on peak sun hours in this section covers how much light arrives at your address. This one is about one of the losses that sit between that light and the meter — the one that gets larger exactly when the island is at its loudest about sunshine.
What the rating is measured at
A panel's headline figure is measured under standard test conditions: a steady thousand watts of sunlight per square metre in the plane of the array, with the array itself at 25 °C.
Read that second condition again. Not 25 °C of air in the shade — 25 °C of panel. It is a laboratory reference, chosen so that two panels can be compared on equal terms, and nothing about it promises a roof.
Why the cells run hotter than the air
Sunlight that is not converted to electricity leaves as heat, and a panel is a dark sheet in full sun with a limited number of ways to shed it.
The model the European Commission publishes with PVGIS puts module temperature at air temperature plus the in-plane irradiance divided by a pair of coefficients — one fixed, one multiplied by wind speed. For a free-standing crystalline silicon module those coefficients are 26.9 and 6.2 in the units the manual gives.
Two readings follow from that shape. Strong sun raises module temperature above air temperature, so the gap is widest at midday in summer. And wind subtracts from it, which is why a clear breezy day in spring beats a still August afternoon.
The coefficients themselves depend on how the module is mounted. A panel with air moving behind it and a panel laid tight against a roof surface are not the same thermal problem, and the difference is a mounting decision, not a purchase decision.
The physics, and the part that belongs to the panel
Two things are being confused whenever this subject comes up in a sales conversation.
That output falls as cells heat is physics. It applies to every silicon panel ever made, at every price. No product avoids it and no installer can design it away.
How steeply it falls is a property of the specific panel. It is a measured quantity: IEC 61853-1 sets out how a module's power is characterised across a matrix of irradiance and temperature values, so the figure in a datasheet comes from a defined test rather than from marketing.
In the crystalline silicon model behind PVGIS, relative efficiency carries a term of −0.0047 for each degree the module sits above the reference temperature — roughly half a percent of output per degree at reference irradiance. A panel running well above the reference temperature is therefore producing meaningfully less than its label, all day, every summer day.
What this does to a Cyprus year
It does not make solar a bad idea here; the extra sunlight more than pays for the extra heat. What it does is move the shape of the year.
Spring and autumn punch above their weight. Deep summer produces a great deal in total because the days are long and clear, but each individual hour underperforms its own paperwork.
It also means a production estimate has to say where its temperature assumption came from. PVGIS itself will apply a generic 8% temperature loss if you tell it the module type is unknown — a value its manual describes as reasonable for temperate climates. Cyprus is not a temperate climate, and a quote built on an untouched default has quietly borrowed a number from somewhere else.
The same applies to the tool's overall default for system losses, 14%, which covers cables, inverter and dirt together. Defaults are a starting point. A quote that never moved off them has not been calculated for your roof.
What to ask an installer
The point of all this is a conversation, not a calculation you do alone.
- what module temperature the production estimate assumed for July and August, and where that assumption came from
- how the mounting plan affects the temperature behind the panels on this particular roof
- which temperature coefficient the proposed modules carry, and how it was accounted for in the yearly figure
- what the estimate would look like if the summer months were modelled separately from the spring ones
If the answer to any of these is that the software handled it, ask what the software was told.